
Selected works > Enhancing Meal Preparation

Diary Study: Enhancing Meal Preparation
A conceptual qualitative data research study for Amazon-Whole Foods
UX Research | Empathy Mapping | Diary Study.Summary
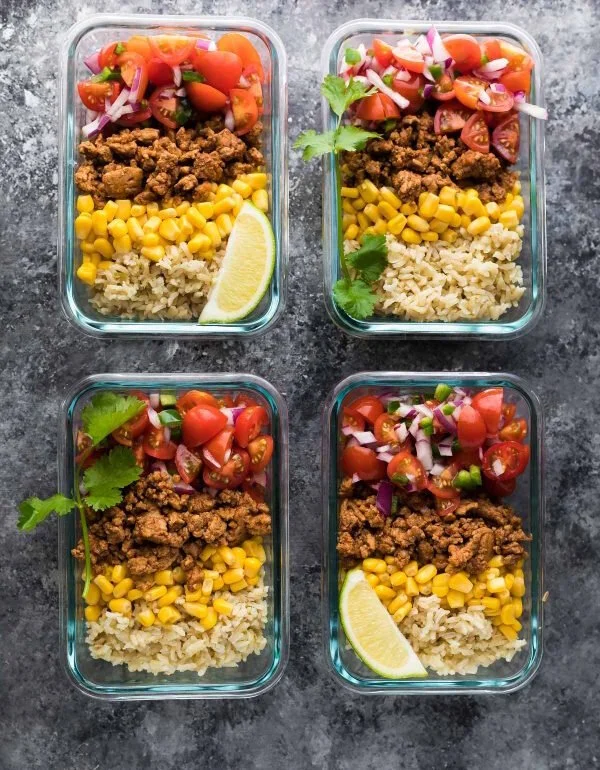
Amazon recently acquired the eco-minded supermarket chain Whole Foods, and they’re looking for new products and service opportunities that will serve future customers in their meal preparation. Our role as UX Designers / Researchers is to help them understand the current experience of meal preparation and the goals users have around prepared meals.
MY ROLEUX Researcher
TYPEAcademic
TIMELINE2 Weeks
TEAM
Oluwatoni Daramola, Alexa MacLean, Dana Faraough, Lili Wang and Lillian Leung
Problem Space
Amazon Whole Foods is looking for new products and service opportunities that will serve future customers in their meal preparation.
The Research Question
“How do you select what to eat while at home?”
Sub Questions
After determining our main research question, we created 3 sub questions. These sub questions would be used to collect data from our participants when completing their diary entries. We asked our participants to submit an entry everytime they prepared a meal or snack. Below are the prompts we used per entry:

The Process Overview

Data Entry Details
Five participants were recruited to complete this study.
The duration of the study was 3 days (November 30 — December 3, 2020). Each day the participants were asked to enter 3 to 5 entries whenever they ate or made their meal or snacks.
We made the instructions for our participants as well as the forms and channels for us to contact them.
We communicated the study and the instructions with our participants and monitored the entries over the 3 day period. After collecting all the data we used affinity diagrams to categorize the qualitative data and analyzed the data into different themes.
Data Entry Results
Some of the data we collected over the course of 3 days with minimum 3 entries from each participant:
Q 1. Did you plan your meal ahead of time or was it spontaneous?

Q 2. Did you plan your meal ahead of time or was it spontaneous?

Q3. Why did this feel like the right thing to make?
To analyze the data we took the data on an Affinity Diagram and created categories to extract themes:

Analysis of Affinity Diagram
The affinity diagram allowed us to remove any non-useful data. We broke the data into categories which included; convenience, fast, available, easy to make, nutrition facts matter, expiring soon, satisfaction, leftovers, taste good/feels good and routine foods. Using this method we were able to categorize all of the entries made by our participants and identify patterns and common themes.
A pie chart was created to break down the categories used in the affinity diagram further. Using the pie chart we can identify the top categories in our study and allow us to focus on particular topics. These five categories are Food plan, Quick and Delicious meals, leftovers, cravings, reliable and familiar recipes. Based on these categories we will analyze the data further to identify patterns and themes.
Food Plan: 39% of participants plan out their meals almost as much as they spontaneously whip up a dish.
Quick and delicious meals: 21% of participants specified that these two characteristics were their concern.
Cravings: 19% of foods are chosen because of their good taste or good feelings.
Leftovers: About 11 % of meals are prepared because they were carried over from previous meal times.
Reliable and familiar recipes: About 10 % of meals are prepared because participants get used to them.
Proposition

Reflection
Learnings
We learned the importance of using both quantitative and qualitative data and the value each type has pertaining to answering our research question.
Although, the response visualizations generated from the quantitative data provided through Google Forms made the initial synthesis convenient and immediately readable. We quickly realized the qualitative data we received provided the context and information that no amount of numbers could ever help with. For example, we could not have given the second opportunity and recommendation (‘Participants enjoy food that brings up good memories and comfort’) without seeing the participants’ answers and reasoning for their meals, which were motivated more by cravings than hunger.
What we could have explored
11% of the entries showed that participants consumed leftovers. We are curious about whether they enjoy the leftover food? Why did they leave leftovers? Is it because they don’t know how to control the amount or just because they feel it’s more convenient to prepare two meals at one time? If we were given a chance to study this further, we would have liked to delve deeper in order to obtain more insights.